Read Bandwidth
For this benchmark, HD Tune Pro was used. It shows the potential read speed which you are likely to experience with these storage devices. We don’t put much stock in Burst speed readings and thus we no longer included it. The most important number is the Average Speed number. This number will tell you what to expect from a given drive in normal, day to day operations. The higher the average the faster your entire system will seem.

Write Performance
For this benchmark HD Tune Pro was used. To run the write benchmark on a drive, you must first remove all partitions from that drive and then and only then will it allow you to run this test. Unlike some other benchmarking utilities the HD Tune Pro writes across the full area of the drive, thus it easily shows any weakness a drive may have.

The sequential file performance of this new series is everything you could expect from a SATA AHCI based model. That is to say very good.
ATTO Disk Benchmark
The ATTO disk benchmark tests the drives read and write speeds using gradually larger size files. For these tests, the ATTO program was set to run from its smallest to largest value (.5KB to 8192KB) and the total length was set to 256MB. The test program then spits out an extrapolated performance figure in megabytes per second.


In and out of RAID scenarios the MX300 2050GB SSD is impressive. A lot of this is of course due to the fact that it uses a mega sized pseudo-SLC cache buffer… but users really do not care about the ‘how’ or the ‘why’ and only that it does… and boy does it ever do just that.
Crystal DiskMark
Crystal DiskMark is designed to quickly test the performance of your hard drives. Currently, the program allows to measure sequential and random read/write speeds; and allows you to set the number of tests iterations to run. We left the number of tests at 5 and size at 100MB.


AS-SSD
AS-SSD is designed to quickly test the performance of your drives. Currently, the program allows to measure sequential and small 4K read/write speeds as well as 4K file speed at a queue depth of 6. While its primary goal is to accurately test Solid State Drives, it does equally well on all storage mediums it just takes longer to run each test as each test reads or writes 1GB of data.


Finally we get to see what the MX300 series looks like when its firing on all cylinders. This model really is the ‘MX300 unleashed’… and holy Christ(mas) is it a sight to behold.
IOMETER: File Server Test
To test each drive we ran 6 test runs per device (1,4,16,64,128,256 queue depth) each test having 8 parts, each part lasting 10 min w/ an additional 20 second ramp up. The 6 subparts were set to run 100% random, 75% read 25% write; testing 512b, 4k,8k,16k,32k,64k size chunks of data. When each test is finished IOMeter spits out a report, in that reports each of the 6 subtests are given a score in I/Os per second. We then take these 8 numbers add them together and divide by 6. This gives us an average score for that particular queue depth that is heavily weighted for file server usage.

Crucial’s MX series has never been targeted at the workstation marketplace so it comes as little surprise that the MX300 is not great at such tasks. By the same token when you combine two of them in a simple RAID they do produce rather impressive workstation-esque performance. Color us impressed.
Crucial MX300 2050GB -System Boot Time
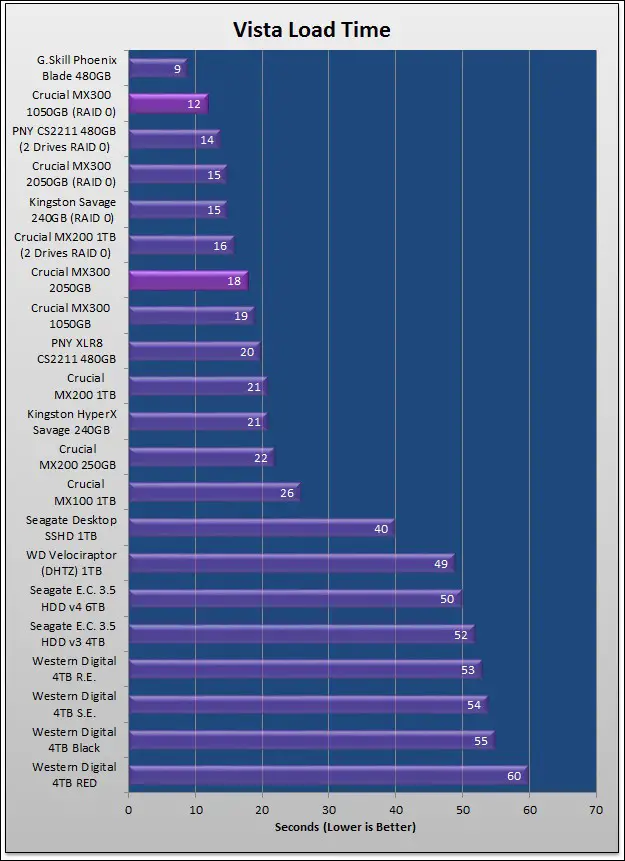
When it comes to hard drive performance there is one area that even the most oblivious user notices: how long it takes to load the Operating System. While all the other tests were run with a Windows 7 operating system, this particular test uses another older test bed’s “day to day” OS (copied over to our new testbed) which has accumulated a lot of crud over the months from installs and removals. We chose the Anti-Virus splash screen as our finish line as it is the last program to be loaded on start up.
Real World Data Transfers
No matter how good a synthetic benchmark like IOMeter is, it cannot really tell you how your hard drive will perform in “real world” situations. To this end we will be running timed data transfers to give you a general idea of how its performance relates to real life use. To help replicate worse case scenarios we will transfer a 30.00GB contiguous file, then a folder containing 1200 subfolders with a total 36,000 files varying in length from 200mb to 100kb (15.00 GB total).
Testing will include transfer to and transferring from the devices, using MS RichCopy and logging the performance of the drive. Here is what we found.


In and out of RAID the 2050GB is easily the pick of the MX300 litter. Its combination of massive onboard RAM with a massively over-sized SLC write cache buffer really does make all the difference.
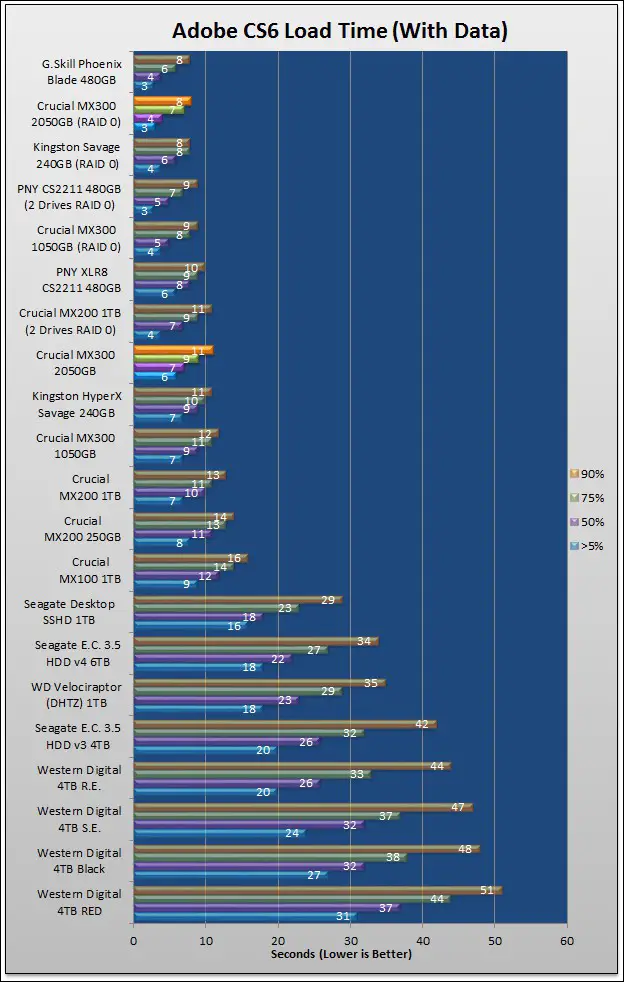
ADOBE CS6 LOAD TIME
Photoshop is a notoriously slow loading program under the best of circumstances, and while the latest version is actually pretty decent, when you add in a bunch of extra brushes and the such you get a really great torture test which can bring even the best of the best to their knees. Let’s see how our review unit faired in the Adobe crucible!

VMWare Load Time Performance
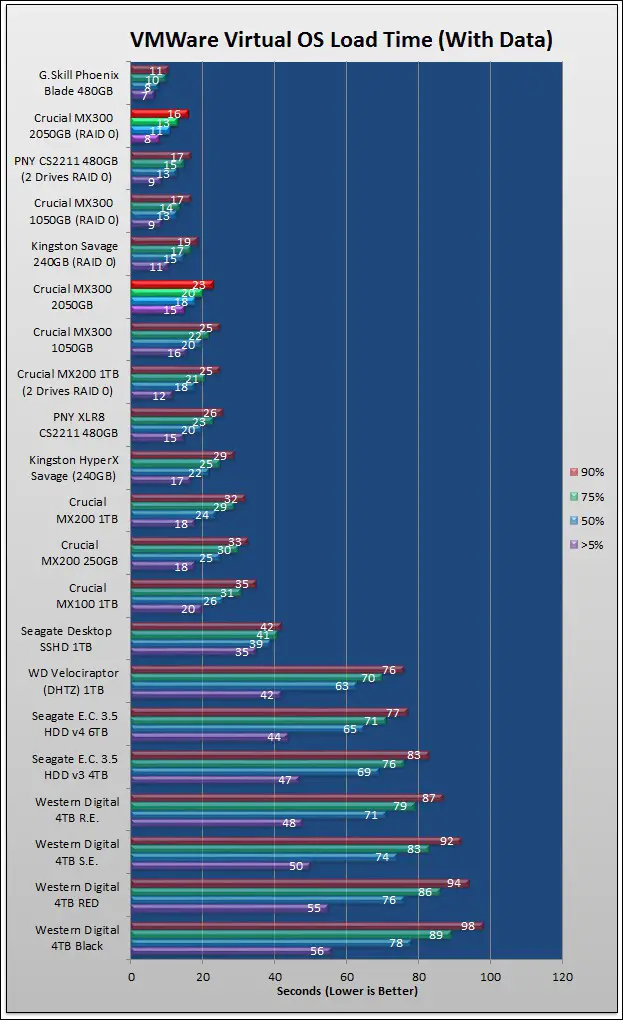
VMWare is a powerful application which allows users the ability to run a virtualized Operating System from inside their main OS. This program is not only processor and RAM intensive but puts significant load on the storage subsystem with deep, heavy read/write IO requests to the drive. To help give you a general idea on the performance improvements from running a RAM Drive we have timed the time it takes to load XP SP3 from inside VMWare.

While the MX300 series was never intended for these types of scenarios the 2050GB model would have to believing otherwise! This mainstream drive really can whistle the tune and make you believe it was an enthusiast orientated model… just without the enthusiast grade price tag.
Borderlands 2 Load time
For Borderlands 2 we have recorded the time it takes to fast travel from Sanctuary map to Oasis. Oasis is the beginning of the Captain Scarlett and Her Pirate’s Booty DLC. This was chosen as it not only is a special level not included in the original Borderlands 2 game and thus contains additional data which should slow the load of this special map.

CoD: Ghosts Load time
For the Call of Duty: Ghosts we timed the level load time for the map called Into the Deep in the single player game. This level was chosen as it contains a large map and loads a lot of data from the storage device to the GPU.

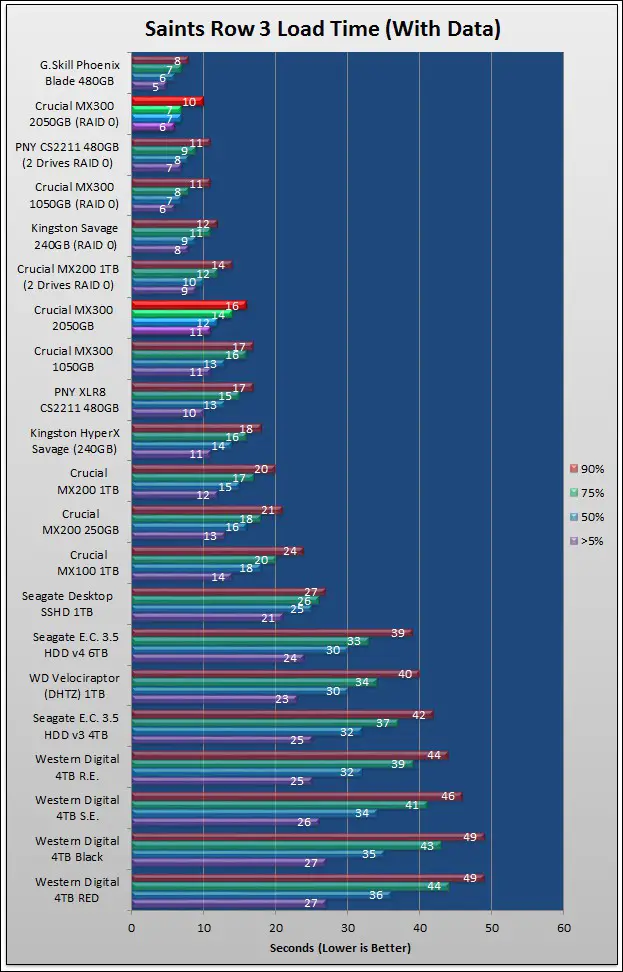
Saints Row 3 Load time
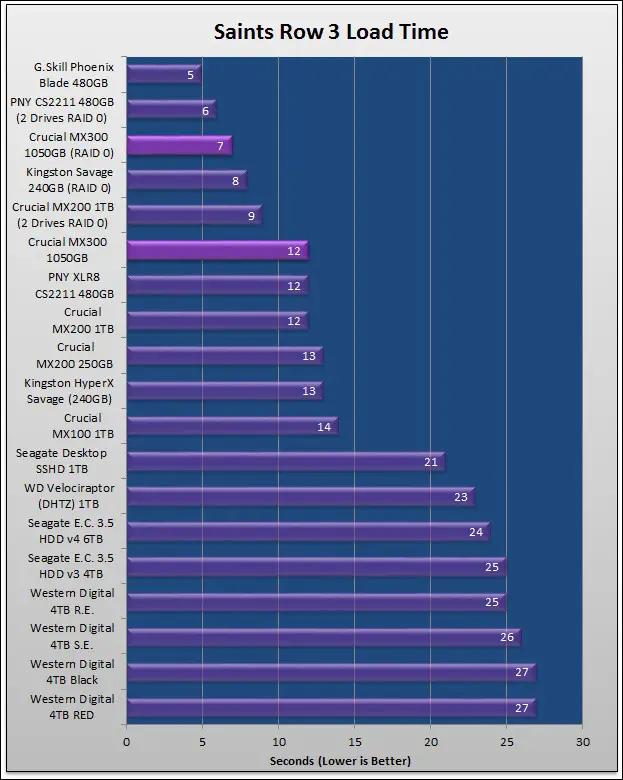
For Saints Row 3 (labelled ‘SR3’ in the chart) we have recorded the load time from a specific save game. The game was saved just at the end of the ‘Shaundi saved’ version of “Three Way Ending” but before the cut scene. This was chosen as the game not only loads the Three Way Ending data but also the next level “Gangsta’s in Space” DLC level.
Good god this drive is fast. So fast that it makes other models, which cost a lot more per GB than it, look slow. That mega-sized SLC buffer with mega-sized RAM buffer really does make a world of difference.
Partial and Full Drive Performance
While it is important to know how a drive will perform under optimal conditions, more realistic scenarios are just as important. Knowing how drive will behave when partially or even nearly full than when it is empty is very important information to know. To quickly and accurately show this crucial information we have first filled the drive to 50% capacity and re-tested using both synthetic and real world tests. After the completion of this we then re-test at 75% and 90% of full capacity.
Synthetic Test Results
For our synthetic testing we have opted for our standard VMWare test.
Real World Results
For a real world application we have opted for our standard Adobe CS6, and Saints Row 3 tests.
While Marvell based units have gained a reputation for performance droop the combination of a whopping 1GB onboard ram cache with a pseudo-SLC write buffer that is mind boggling large does limit this issue nicely. Simply put the MX300 2050GB is the best Marvell based unit we have ever seen.
